
Response Vector Chart Calculator
A response vector is a set of numerical values representing the intensity measured in each spectral band.
Consider a small region of interest captured by all imaging modalities. Use the color sampler tool with a sample size of 31 by 31 average. Enter L* values for each wavelength band to generate the bar chart.
Reference Line:
Red dashed line at L* = 80 (Dark/Light Threshold)
Enter CIELAB L* Values
*This method uses perceptual L* data (CIELAB). It calculates reflectance from percieved brightness levels (human vision-based conversion). This method gives mathematically derived reflectance based on simplified perceptual data. It does not involve sensor calibration, which would provide linear sensor behavior.
-------
Multiband imaging isn’t typically calibrated like multispectral and hyperspectral imaging. However, you could in theory calibrate the results to provide a more accurate calculation. This is how:
-------
Multiband imaging isn’t typically calibrated like multispectral and hyperspectral imaging. However, you could in theory calibrate the results to provide a more accurate calculation. This is how:
*To convert L* values to reflectance, the code uses the standard, piecewise equation derived from the CIELAB color space conversion.
For L* values above 8:

For L* values 8 and below it is linear:


Raw image: pixel values from image of the object. Neutralize all adjustments in camera raw, set color space to ProPhoto RGB or Adobe RGB, 16 bits/channel.
Dark reference: pixel values from image captured with the lens cap on, same exposure time as Raw to record any sensor dark curent and baseline noise.
White reference: pixel values from image of lambertian reflectance standard (99% Spectralon), to record sensor response to known reference.
---
Step by step sensor-based calibration method:
This example is for cobalt blue:
- Raw Image RGB: (79, 109, 169)
- Raw Image IR: (233, 233, 233)
- Raw Image UVR: (187, 187, 187)
- Dark Reference RGB: (0, 0, 0) - a healthy sensor will read 0s.
-
White Reference RGB: (244, 244, 244) - properly calibrated should be same # across channels.
You’d calculate reflectance separately for each RGB channel:
Red channel reflectance (%):

Green channel reflectance (%):
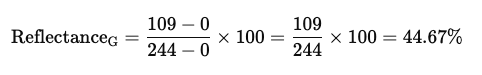
Blue channel reflectance (%):

IR channel reflectance (%):

UVR channel reflectance (%):

Differences in calculation results, same colorant reference -
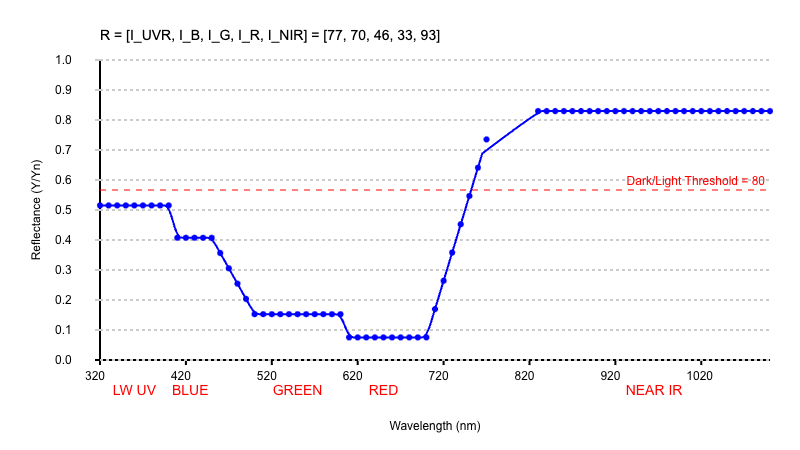
Response Vector Chart approximate L* values:
Measures how humans perceive brightness
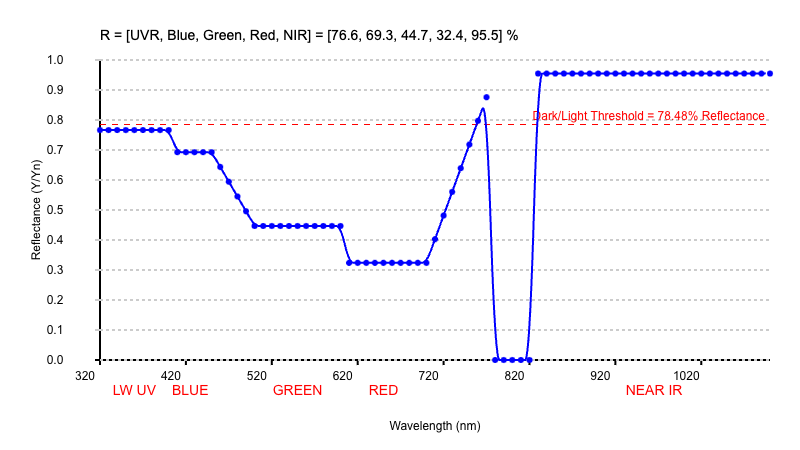
Response Vector Chart calculated values with sensor-based calibration:
Measures actual reflected light intensity, suitable for scientific analysis and archival documentation. There is some approximation between channels, however you will notice a drop in the chart between the Red and NIR bands which emphasizes the lack of data recorded between 700-830nm.
Measures actual reflected light intensity, suitable for scientific analysis and archival documentation. There is some approximation between channels, however you will notice a drop in the chart between the Red and NIR bands which emphasizes the lack of data recorded between 700-830nm.
*If you want to attempt to use the calibrated calculator after following the above formulae - click HERE